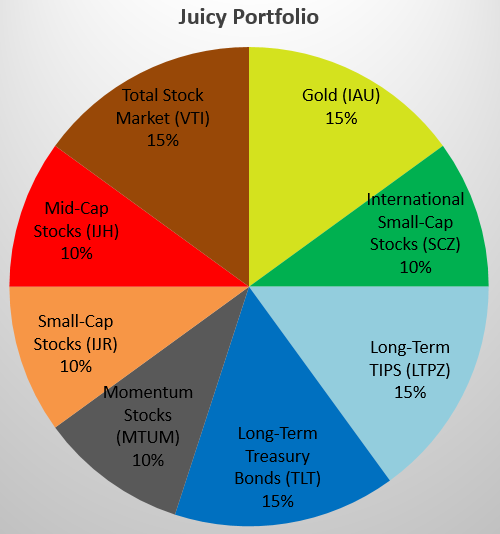
Low-cost index funds
| Exchange-traded fund (ETF) | Symbol | Percent of Portfolio | Expense Ratio | Morningstar Rating |
|---|---|---|---|---|
| iShares Gold Trust Gold |
IAU | 15% | 0.25% | N/A |
| iShares MSCI EAFE Small-Cap International Small-Cap, Developed Nations index |
SCZ | 10% | 0.40% | 4 star |
| iShares 20+ Year
U.S.Treasury Bond U.S. Long-term Treasury Bond index |
TLT | 15% | 0.15% | 4 star |
| PIMCO 15+
Year U.S. TIPS Bond U.S. Long-term TIPS Bond index |
LTPZ | 15% | 0.20% | 5 star |
| iShares
MSCI USA Momentum Factor U.S. Stock Market, stocks with momentum index |
MTUM | 10% | 0.15% | 3 star |
| iShares Core S&P Small-Cap Blend U.S. Stock Market, Small-Cap 600 index |
IJR | 10% | 0.06% | 5 star |
| iShares Core S&P Mid-Cap Blend U.S. Stock Market, Mid-Cap 400 index |
IJH | 10% | 0.05% | 5 star |
| Vanguard Total Stock Market U.S. Stock Market, Total index |
VTI | 15% | 0.03% | 4 star |
| Total weighted annual expense ratio | 0.16% | |||
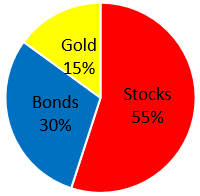
Overall asset class allocation
| Asset Class | Percent of Portfolio |
 |
|---|---|---|
| Stocks | 55% | |
| Bonds | 30% | |
| Gold | 15% | |
| Cash | 0% |
Description
Inspired by the
Permanent Portfolio,
the Juicy Portfolio is a
passive portfolio
with
no cash. No market timing.
Buy and hold. Rebalance yearly. Its intended for USA investors. Since there's no cash in the portfolio, its
intended for those who already have an adequate cash emergency fund (12 months living
expenses).
The non-correlated asset classes (Stocks, Long-Term Bonds, Gold) are based on the
Permanent Portfolio concept and provide superior protection for all economic
conditions. In total, the 8 funds of the Juicy Portfolio create a
simple, diversified, all-weather investment approach.
Objective
Provide strong long-term capital appreciation with low volatility.
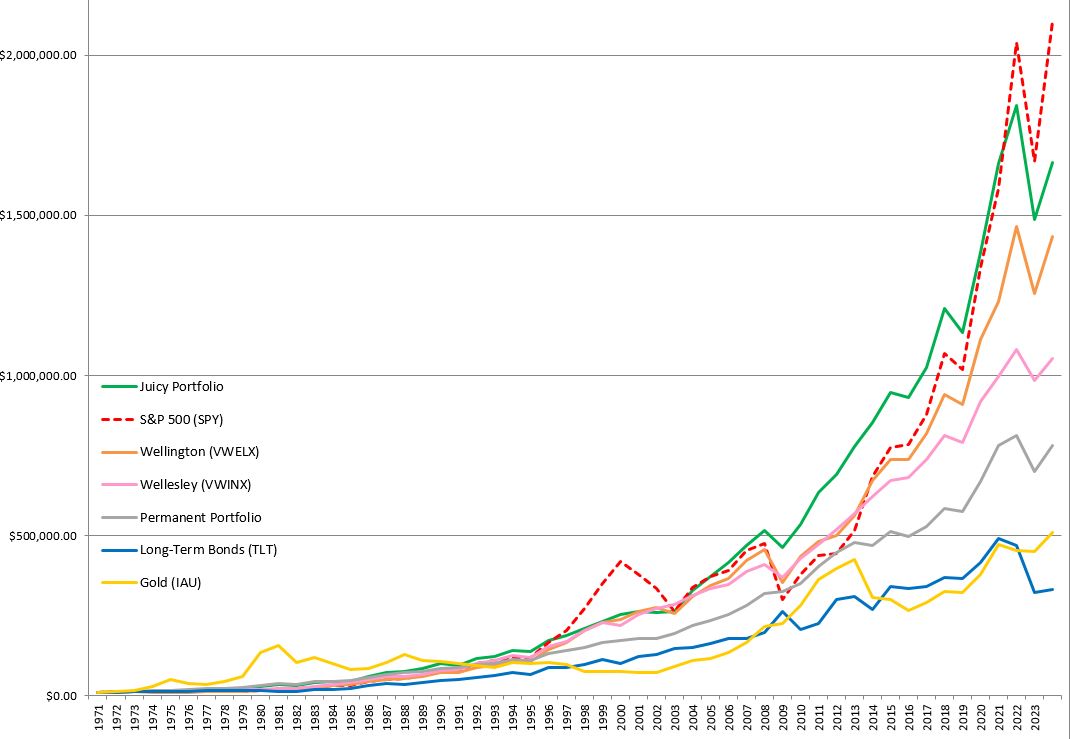
Performance
Starting from 1971 it has returned a ~10% Compound Annual Growth Rate (Annualized Return). A solid track record of strong growth with low volatility. The spreadsheet data below shows how each asset performed yearly, going back to 1971
when the US went off the Gold
Standard.
| 10% | 15% | 15% | 10% | 15% | 10% | 10% | 15% | 100.00% | starting balance | |
| Year | Momentum (MTUM) | LT TIPS (LTPZ) | Gold (IAU) | International (SCZ) | LT Treasuries (TLT) | Small-Cap (IJR) | Mid-Cap (IJH) | Total Stock (VTI) | Yearly Returns % | $10,000.00 |
| 1971 | 14.65 | 29.59 | 9.79 | 15.81 | 14.31 | 14.31 | 14.68 | $11,468.30 | ||
| 1972 | 49.02 | 36.35 | 5.43 | 14.14 | 8.02 | 18.78 | 19.53 | $13,707.83 | ||
| 1973 | 72.96 | -14.92 | -1.36 | -14.96 | -24.20 | -14.66 | 1.46 | $13,908.38 | ||
| 1974 | 66.15 | -23.16 | 4.13 | -10.39 | -26.34 | -26.47 | -1.45 | $13,707.40 | ||
| 1975 | -24.80 | 35.39 | 8.92 | 26.16 | 48.69 | 37.20 | 19.28 | $16,350.19 | ||
| 1976 | -4.10 | 2.54 | 16.50 | 21.62 | 36.67 | 23.84 | 16.38 | $19,028.02 | ||
| 1977 | 22.64 | 18.06 | -0.96 | 6.51 | 1.30 | -7.84 | 3.74 | $19,738.72 | ||
| 1978 | 37.01 | 32.62 | -1.46 | 6.83 | 8.97 | 5.87 | 11.42 | $21,993.47 | ||
| 1979 | 126.55 | 4.75 | -1.46 | 34.39 | 31.48 | 18.05 | 30.12 | $28,617.68 | ||
| 1980 | 15.19 | 22.58 | -4.25 | 44.01 | 30.76 | 31.92 | 18.72 | $33,974.48 | ||
| 1981 | -32.60 | -2.28 | 1.64 | -2.83 | 4.10 | -5.21 | -5.80 | $32,003.45 | ||
| 1982 | 14.94 | -1.86 | 40.04 | 46.42 | 25.21 | 20.97 | 26.47 | $40,475.57 | ||
| 1983 | -16.31 | 23.69 | 0.44 | 18.15 | 27.11 | 21.29 | 9.90 | $44,483.86 | ||
| 1984 | -19.38 | 7.38 | 15.20 | -25.17 | -1.74 | 6.21 | 1.25 | $45,041.02 | ||
| 1985 | 6.00 | 56.16 | 30.66 | 23.07 | 32.79 | 31.23 | 29.11 | $58,151.34 | ||
| 1986 | 18.96 | 69.44 | 24.18 | 0.20 | 17.12 | 18.06 | 23.29 | $71,694.20 | ||
| 1987 | 24.53 | 24.63 | -2.92 | -6.99 | 0.84 | 4.71 | 5.83 | $75,873.26 | ||
| 1988 | -15.26 | 28.27 | 9.15 | 24.63 | 19.44 | 16.22 | 11.75 | $84,784.57 | ||
| 1989 | -2.84 | 10.54 | 17.93 | 10.55 | 26.00 | 31.36 | 17.50 | $99,623.57 | ||
| 1990 | -3.11 | -23.45 | 5.78 | -18.13 | -10.73 | -3.32 | -4.79 | $94,848.11 | ||
| 1991 | -8.56 | 12.13 | 17.43 | 45.26 | 40.44 | 30.22 | 21.28 | $115,034.64 | ||
| 1992 | -5.73 | -12.17 | 7.41 | 18.20 | 15.19 | 7.42 | 5.34 | $121,178.06 | ||
| 1993 | 17.68 | 32.56 | 16.79 | 18.70 | 16.20 | 10.62 | 17.09 | $141,887.39 | ||
| 1994 | -2.17 | 7.78 | -7.04 | -0.51 | -1.72 | -0.17 | -1.93 | $139,156.06 | ||
| 1995 | 0.98 | 1.16 | 30.09 | 28.74 | 33.22 | 35.79 | 24.43 | $173,156.76 | ||
| 1996 | -4.59 | 0.95 | -1.26 | 18.12 | 18.97 | 20.96 | 7.98 | $186,970.34 | ||
| 1997 | -21.41 | -22.72 | 13.90 | 24.59 | 25.66 | 30.99 | 11.46 | $208,395.27 | ||
| 1998 | -0.83 | 5.27 | 13.05 | -2.61 | 9.90 | 23.26 | 10.86 | $231,030.12 | ||
| 1999 | 0.85 | 19.04 | -8.66 | 23.13 | 15.32 | 23.81 | 9.23 | $252,356.51 | ||
| 2000 | -5.44 | -3.08 | 19.72 | -2.67 | 18.10 | -10.57 | 3.69 | $261,674.78 | ||
| 2001 | 0.75 | -4.59 | 4.31 | 6.43 | -1.24 | -10.97 | -1.28 | $258,333.19 | ||
| 2002 | 25.57 | 5.79 | 16.67 | -14.31 | -14.21 | -20.47 | 1.45 | $262,068.69 | ||
| 2003 | 19.89 | 66.48 | 1.62 | 38.50 | 35.21 | 30.75 | 25.18 | $328,047.10 | ||
| 2004 | 4.65 | 34.80 | 8.71 | 22.41 | 16.09 | 12.79 | 13.84 | $373,442.26 | ||
| 2005 | 17.76 | 23.23 | 8.61 | 7.53 | 12.88 | 6.31 | 11.19 | $415,224.85 | ||
| 2006 | 22.27 | 28.39 | 0.71 | 15.09 | 9.67 | 15.69 | 12.79 | $468,336.26 | ||
| 2007 | 30.36 | 2.95 | 10.29 | -0.47 | 7.30 | 5.37 | 9.96 | $514,989.57 | ||
| 2008 | 5.11 | -48.55 | 33.93 | -31.52 | -36.18 | -36.98 | -9.92 | $463,879.43 | ||
| 2009 | 23.90 | 42.85 | -21.80 | 25.88 | 37.81 | 28.89 | 14.92 | $533,097.20 | ||
| 2010 | 8.67 | 29.46 | 21.50 | 9.05 | 26.60 | 26.72 | 17.42 | 18.91 | $633,927.21 | |
| 2011 | 25.10 | 9.57 | -15.14 | 33.93 | 0.79 | -2.18 | 0.97 | 8.88 | $690,245.30 | |
| 2012 | 11.60 | 6.89 | 21.28 | 2.63 | 16.29 | 17.79 | 16.45 | 12.82 | $778,710.59 | |
| 2013 | -19.21 | -28.25 | 28.60 | -13.37 | 41.32 | 33.46 | 33.45 | 9.58 | $853,279.91 | |
| 2014 | 14.62 | 19.68 | -2.05 | -6.07 | 27.30 | 5.85 | 9.71 | 12.54 | 11.03 | $947,409.49 |
| 2015 | 8.93 | -8.83 | -10.58 | 9.10 | -1.79 | -2.07 | -2.33 | 0.36 | -1.76 | $930,706.66 |
| 2016 | 5.00 | 9.16 | 8.31 | 2.63 | 1.18 | 26.61 | 20.73 | 12.83 | 10.22 | $1,025,815.57 |
| 2017 | 37.50 | 9.06 | 12.91 | 32.73 | 9.18 | 13.15 | 16.26 | 21.21 | 17.82 | $1,208,595.39 |
| 2018 | -1.66 | -7.00 | -1.76 | -17.63 | -1.61 | -8.49 | -11.18 | -5.21 | -6.23 | $1,133,263.64 |
| 2019 | 27.25 | 17.47 | 17.98 | 24.67 | 14.12 | 22.82 | 26.10 | 30.67 | 22.12 | $1,383,941.56 |
| 2020 | 29.85 | 24.87 | 25.03 | 11.69 | 18.15 | 11.28 | 13.58 | 21.03 | 20.00 | $1,660,757.55 |
| 2021 | 13.37 | 6.56 | -4.00 | 10.14 | -4.60 | 26.60 | 24.71 | 25.67 | 11.03 | $1,843,880.98 |
| 2022 | -18.26 | -31.68 | -0.63 | -21.24 | -31.24 | -16.19 | -13.14 | -19.51 | -19.34 | $1,487,237.52 |
| 2023 | 9.16 | 0.79 | 12.84 | 13.01 | 2.77 | 16.07 | 16.42 | 26.05 | 11.86 | $1,663,631.33 |
| CAGR | 10.13 |
Key statistics: 1971-2023
| Annualized Return (CAGR) | 10.13% |
| Best Yearly Gain (1979) | 30.12% |
| Worst Yearly Loss (2022) | -19.34% |
Annualized Returns per decade
| 1970s | 1980s | 1990s | 2000s | 2010s | 2020s | |
| 18.72 | -4.79 | 3.69 | 18.91 | 20.00 | ||
| 14.68 | -5.80 | 21.28 | -1.28 | 8.88 | 11.03 | |
| 19.53 | 26.47 | 5.34 | 1.45 | 12.82 | -19.34 | |
| 1.46 | 9.90 | 17.09 | 25.18 | 9.58 | 11.86 | |
| -1.45 | 1.25 | -1.93 | 13.84 | 11.03 | ||
| 19.28 | 29.11 | 24.43 | 11.19 | -1.76 | ||
| 16.38 | 23.29 | 7.98 | 12.79 | 10.22 | ||
| 3.74 | 5.83 | 11.46 | 9.96 | 17.82 | ||
| 11.42 | 11.75 | 10.86 | -9.92 | -6.22 | ||
| 30.12 | 17.50 | 9.23 | 14.92 | 22.12 | ||
| CAGR | 12.39 | 13.29 | 9.74 | 7.77 | 10.01 | 4.71 |
| 35 years (1989 - 2023) | 30 years (1994 - 2023) | 25 years (1999 - 2023) | 20 years (2004 - 2023) | 15 years (2009 - 2023) | 10 years (2014 - 2023) | ||||||||||||||||||||||||||||||||||||||||||||||||||||||||||||||||||||||||||||||||||||||||||||||||||||||||||||||||||||||||||||||||||||||||||||||||||||||||||||||||||||||||||||||||||||||||||||||||||||||||||||||||||||||||||||||||||||||||||||||||||||||||||||||||||||||||||||||||||||||||||
|
|
|
|
|
|
| 5 years (2019 - 2023), 7.95% Annualized Return |
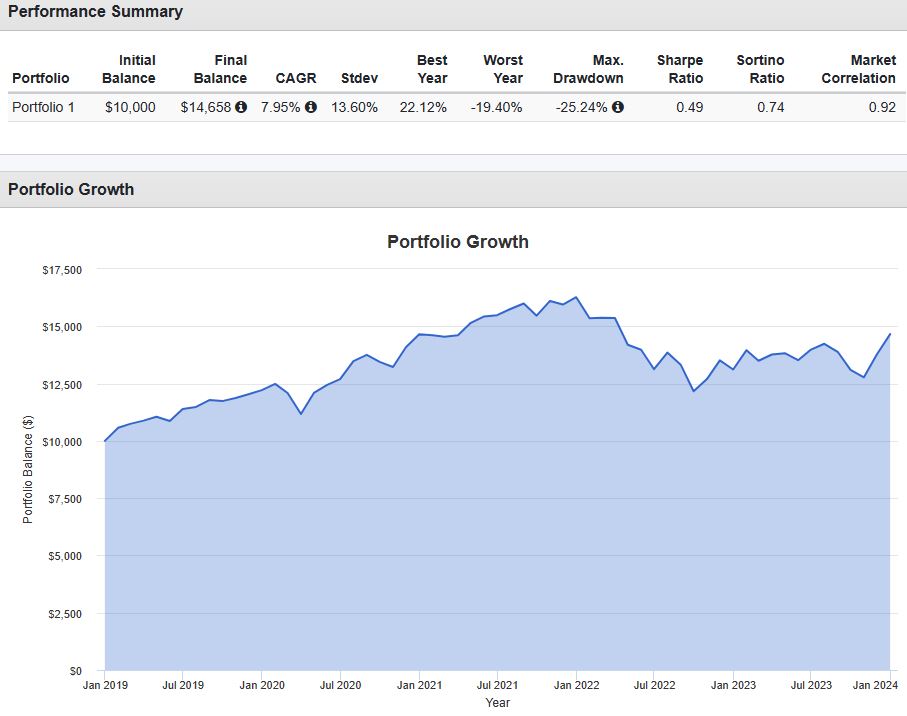 |
The linear graph below shows the growth rate of $10,000 starting in 1971.
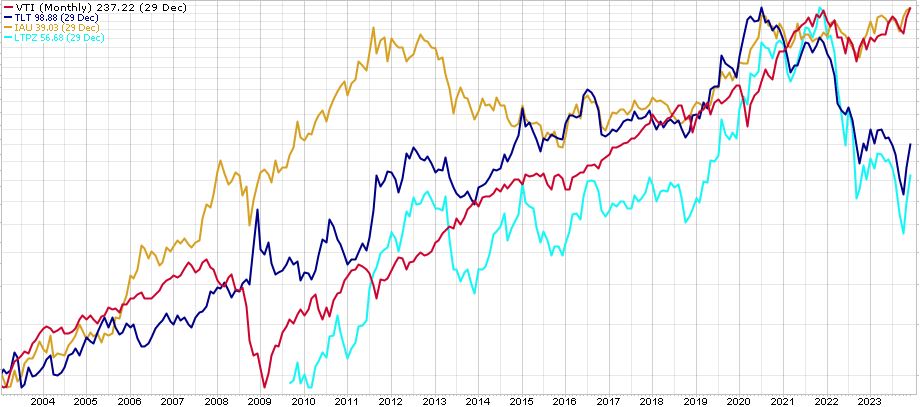
Other historical charts
20 year performance of the major asset classes (Stocks, Long-Term Bonds, Gold)
Data Sources
The yearly returns of
the 8 funds were used since their inception. Prior to that, similar mutual fund data
was used to
backtest to 1971. Below are the URLs of all the data sources.
Disclaimer
Do your own research. The information on this website is not intended to
constitute financial advice, and is not a recommendation or solicitation to buy,
sell or hold any security. It's strictly educational and is
not to be construed as any kind of investment advice.
Past performance does not guarantee future results.
-A.D.
Webpage last updated January 3, 2024.
Email:
webmaster@tightwadweb.com